I want to set the PulseDataLineRenderer values for OxygenSaturation, but I’m clueless on what should be the YMin and YMax value of the class for OxygenSaturation. I’ve tweaked around with different values but couldn’t get any positive response.
OxygenSaturation is provided from Pulse as a fraction between 0 and 1, so you can set you ymin to 0 and ymax to 1. If you want to display it as a percent, multiply the value from Pulse by 100 and set your ymax to 100.
Thanks for the quick response @abray!
I’ve already tried these values, but the LineRenderer still keeps at straight line.
The float value seems to be appearing correctly, but I’m not getting any values or changes in the LineRenderer.
Here is a quick screenshot
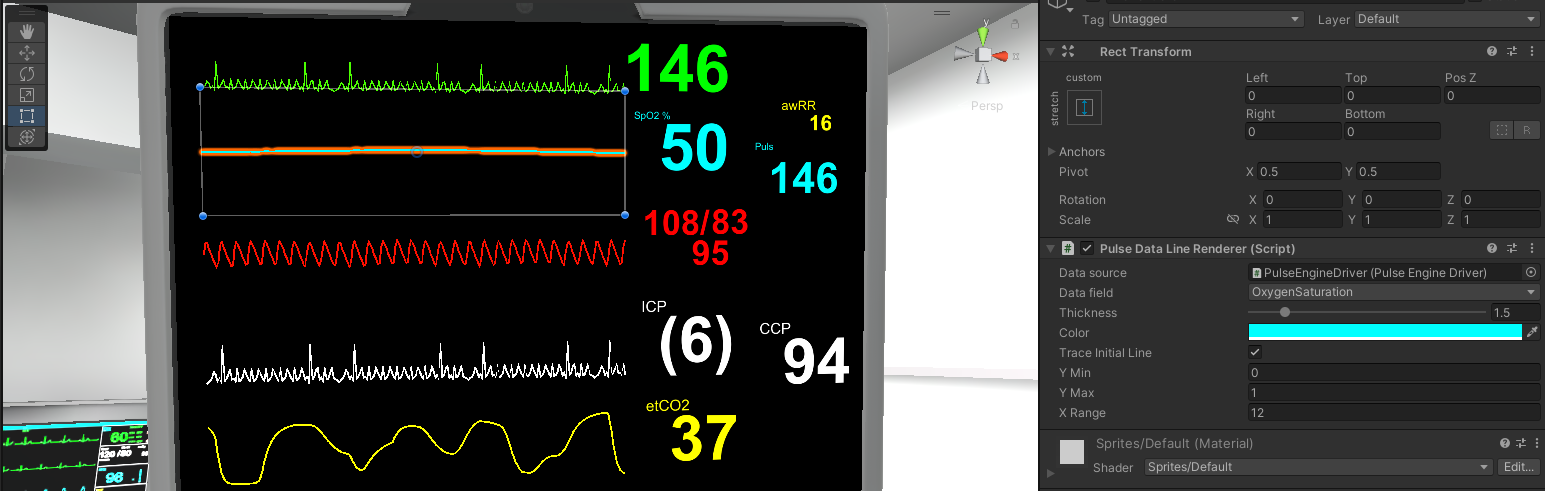
OxygenSaturation is not a waveform. It usually just holds at something like 98. You have to seriously restrict airflow for it to drop, then it will just stay at that value. There is no bounce to it.
Your plot looks like that maybe what’s happened. If it was normal, it would be a horizontal line at the top of its draw space. But now it’s just a horizontal line around the middle of the draw space… Which is reflecting the 50 value you’re displaying.
Okay I got the point now. Thanks for the help! I highly appreciate that