Is there any way to show the Pleth in the PulseDataLineRenderer?
Attaching reference image here:
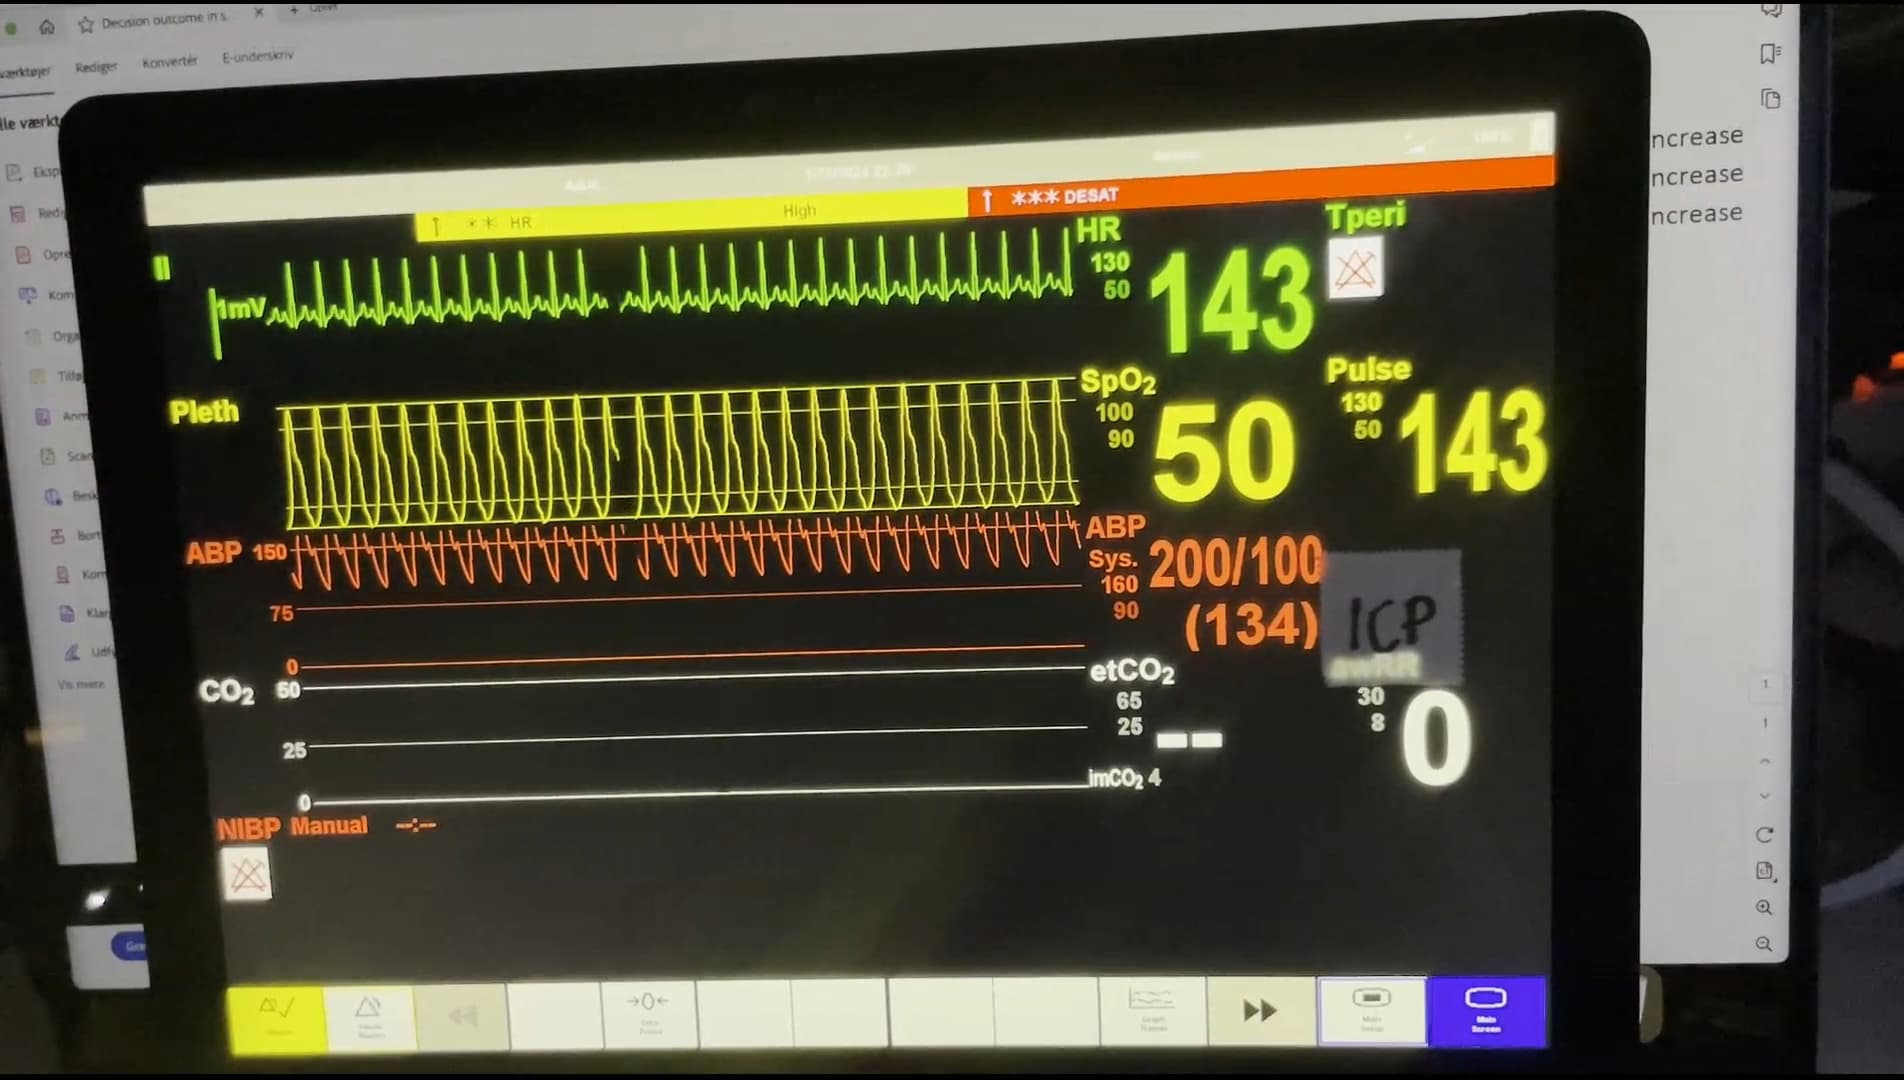
We use the ArterialPressure_mmHg for our Pleth in our Vitals Monitor
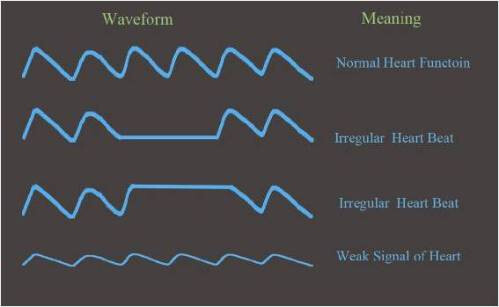
You can see some visuals in this post
Which kind of match up well to [source]
Oh I get it now. And what could be the Y Min and Y Max for that?
I would guess about 120-30 mmHg… maybe 140-20 if you are going extreme
You just want to bound it to your highest/lowest systolic/diastolic pressures